
Marketers are placing more and more of an emphasis on attribution and understanding how different touchpoints drive consumer behavior. With expanded metrics and data available for OOH inventory, it’s now possible to tie actual consumer actions back to ad exposure. The impact of out-of-home advertising on driving foot traffic is particularly significant, and Cuebiq’s recent Footfall Attribution Benchmarks report corroborates this. Read on for OOH insights from this report, and be sure to attend my session on May 21 at the upcoming OAAA/ Geopath 2019 OOH Media Conference to learn more!
Attribution Benchmarks Study Overview
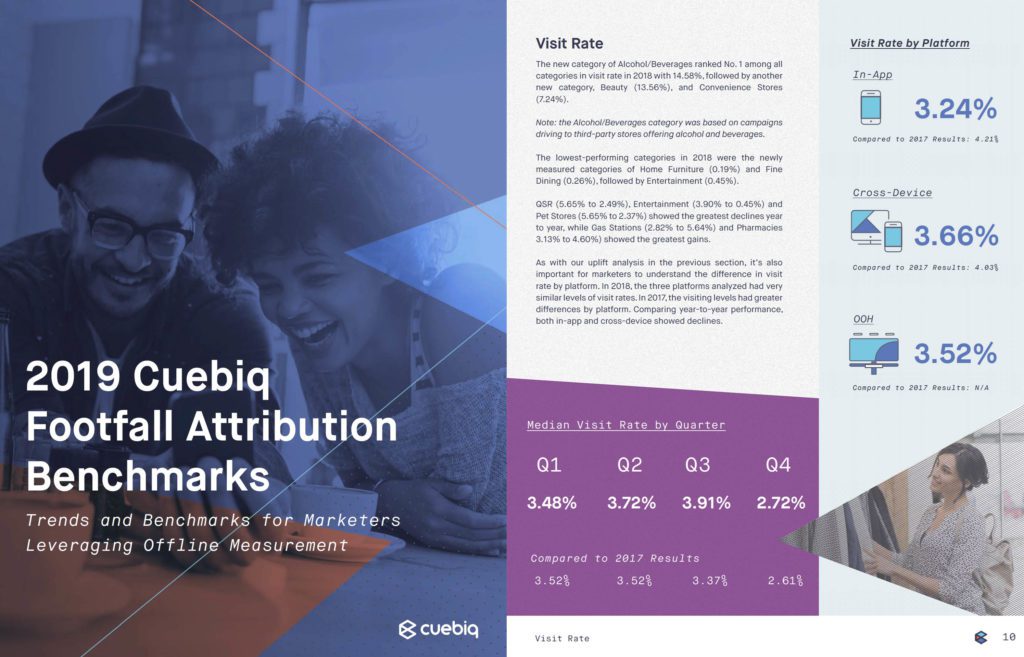
Cuebiq released its third annual study of footfall attribution benchmarks, produced via Cuebiq’s location intelligence and based on an analysis of campaigns across a wide range of industries. Our report offers comparisons on metrics that gauge how advertising campaigns are performing in driving offline activities. It is also broken out by platform and quarter. Because the consumer journey remains predominantly offline, it’s vital that advertisers understand the offline impact and influence of their cross-channel media campaigns.
Download Study
Metrics for Attribution Benchmarks
- brand uplift — the impact of ad exposure in driving in-store visits and the percent difference in visitation rates between exposed and unexposed groups
- visit rate — identifies the average daily Point of Interest (POI) visits
- CPIV (cost per incremental visit) — the budget spent to receive one incremental visit
- dwell time — the amount of time spent at a specific POI
Platform Comparison — Out-of-Home Reins
In our platform comparison this year, we included out-of-home (OOH) and found that this channel contributed the most to driving footfall traffic — with an average uplift of 80–120% compared to mobile-only at 10–89% and cross-device (web and mobile) at 6–39%.
This makes sense because OOH is ubiquitous, unskippable and often appears closest to the point of sale. This advertising channel is also benefiting from advanced technology, like mobile and location data, which now delivers more granular data from a range of sources. As a result, OOH is experiencing year-over-year ad spending increases, with ad revenues predicted to grow to $11.5 billion in 2022.
OOH Success Example
In our report, we also included a case study around a leading regional QSR chain that partnered with Clear Channel Outdoor and Cuebiq to measure their OOH ad effectiveness and consumer engagement with a campaign that ran between June 25 and August 29, 2018.
The campaign saw an impressive 379% uplift, which exceeded the category benchmarks. Moreover, the campaign immediately drove consumers to the restaurant. Of the majority of consumers exposed to the ad, 65% visited a brand location (conversion rate) within one day.
The converted consumers also had a strong correlation with the travel and hospitality categories, with vacationers, upscale hotel stayers and frequent air flyers being among the most popular segments for uplift. These affinities, which are revealed from new advancements in location data, will help this brand further refine their ad placements and targeting in the future.
For more OOH insights, be sure to check out our complete 2019 Footfall Attribution Benchmarks report.


