

Incrementality is Cuebiq’s proprietary methodology to calculate the portion of visits that can be linked (attributed) to the ad exposure during a campaign. For example, if we measure 100 visits to all of your retail stores during a campaign (and attribution window), our algorithm can determine that approximately 15 of those total visits happened because of ad exposure, so your campaign showed an incrementality effect of 15%. This is a powerful insight that will help you understand how effective your campaign was at increasing foot traffic.
We’ve compiled a list of frequently asked questions when it comes to incrementality. Read on to learn more!
What are incremental visits?
Incremental visits are visits that happened most likely because of the ad exposure—as opposed to organic visits which would have happened anyway without a campaign. The total visits measured are the sum of organic and incremental visits. We measure incremental visits cumulatively (they can only increase or will remain the same if we don’t measure any in a day) and show new results daily.
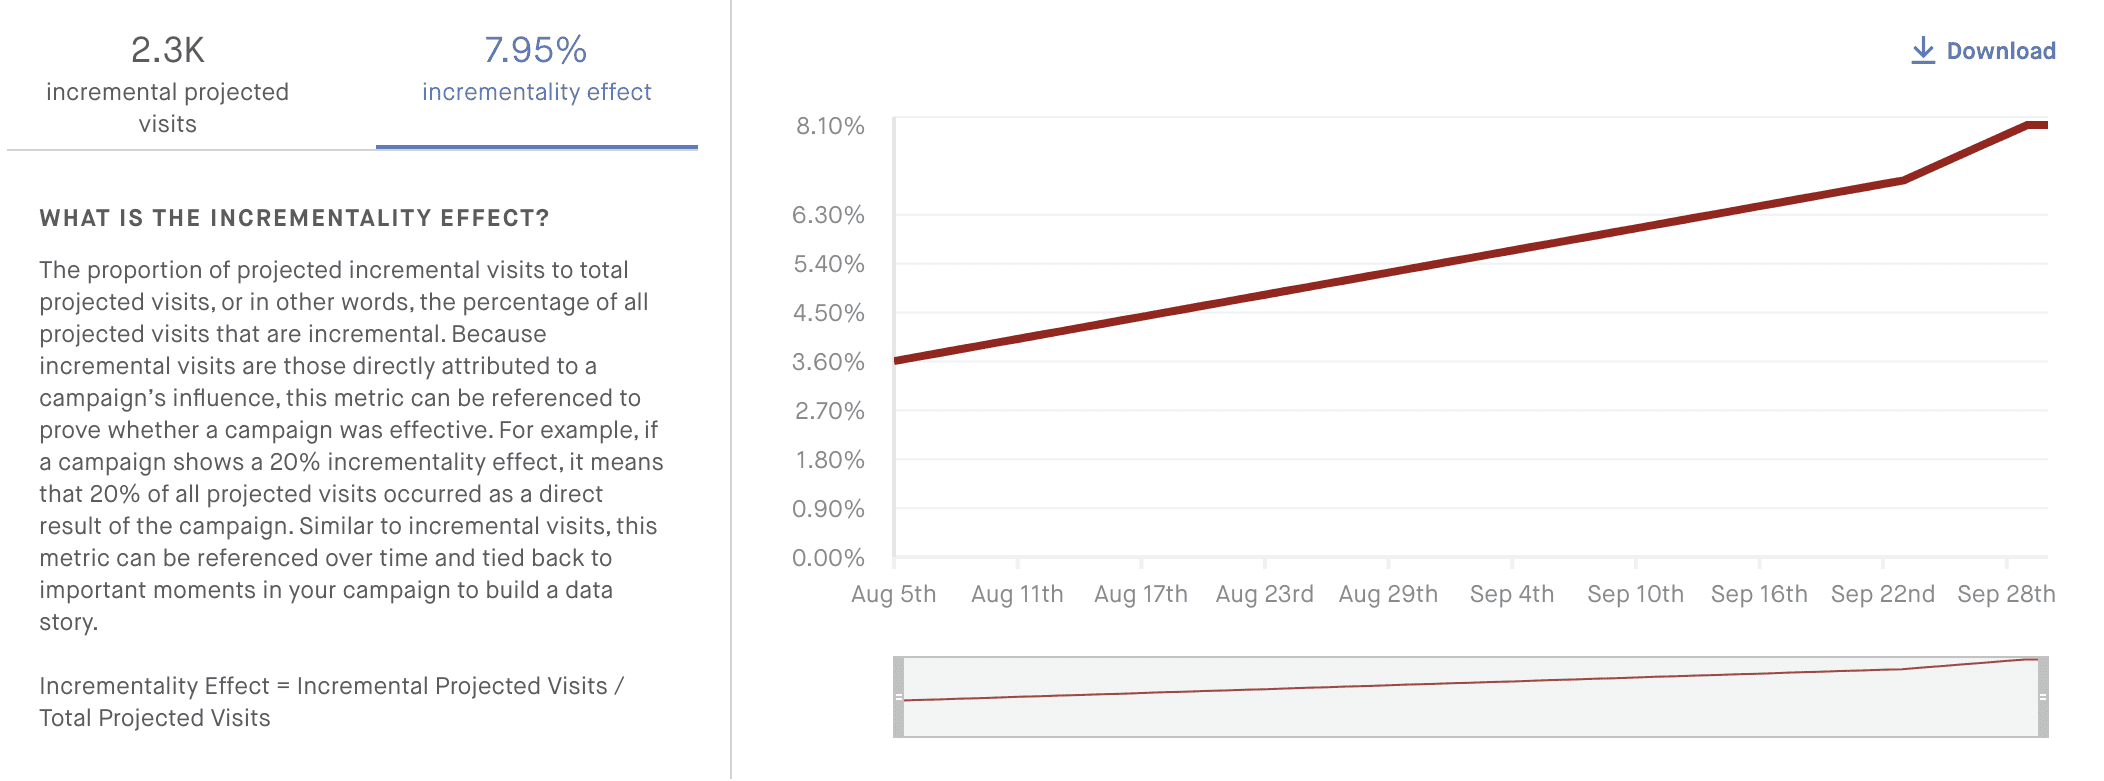
What is the incrementality effect?
The percentage of total visits that are incremental, that is, the percentage of all projected visits that can be attributed to the ad exposure.
Is incrementality at Cuebiq a pre/post test?
No. A pre/post test is made by looking at the visits of a device previous to the exposure, then measuring the visits after the exposure. For example, if I go to my favorite coffee shop 3 times a week, but after seeing an ad I went 4 times this week, the ad yielded one incremental visit. This is subject to seasonality and other methodological issues. At Cuebiq, we use a control group to establish a baseline of behavior for the exposed group to understand campaign effects.
How does the control group come into play for incrementality?
Our methodology uses the control group to establish a baseline for the visitation behavior of the devices in the exposed group. Our model learns the relationship between a device’s visitation history (12 weeks) and the visits to the brand of interest during a campaign. We then transfer the information learned from the control group onto the exposed group, to see how they would have behaved if they had not been exposed.
Why is Cuebiq’s solution better than the competitors?
If you wanted to understand the effect of ad exposure on a customer —let’s call her Amy— would you rather compare Amy against Susan in the control group, or against Amy herself had she not been exposed? At Cuebiq, instead of measuring incrementality by comparing visits in the exposed and control groups, we go one step beyond and compare the exposed group with a mirror (counterfactual) version of itself that behaves as if exposure never happened, so it’s a much cleaner comparison. Additionally, we obtain incrementality results at the device level, allowing us to segment campaign effects by sociodemographics.
How does incrementality relate to uplift?
Uplift measures the percentage difference in visitors during a campaign, whereas incrementality refers to visits during a campaign (and attribution windows).
Can we see campaigns with no uplift but positive incrementality?
Yes. Since uplift measures visitors and incrementality measures visits, a campaign with no uplift but positive incrementality can be interpreted as having increased the visits of the same number of visitors —more visits per visitor.
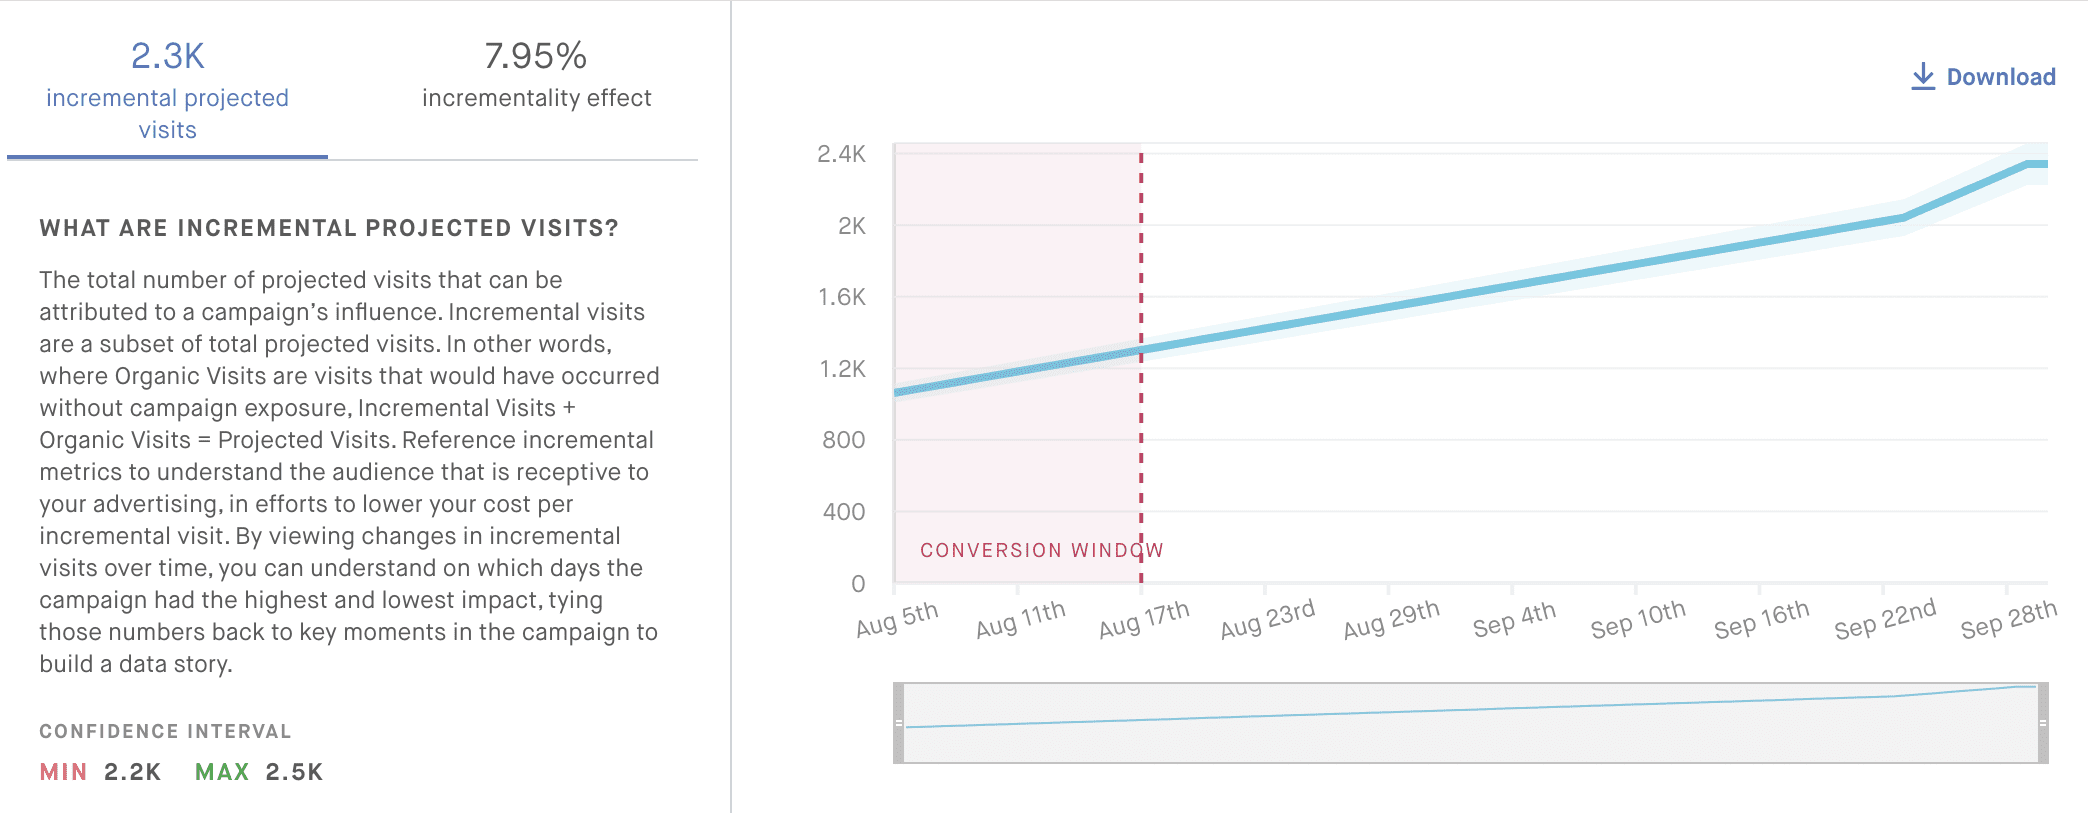
What are projected incremental visits?
From the impression logs we get from our clients, we match those devices present in our panel. We use this subset of the devices to perform our incrementality estimations. Because these measurements are done on a subset of the total devices in the impression log, to provide numbers for the entire campaign we project the visit results from the matched devices back to the impression log. These are the projected incremental visits.
What is the input for the incrementality model? What is a visitation signature?
Our proprietary model takes as input the visit history of a device for 12 weeks previous to the campaign. In other words, we look at every single brand the device has visited in the previous three months to build a visitation signature. Our main insight is that this signature carries significant information about the device’s preferences for brands and lifestyles, which in turn will affect how effective a campaign is for each device.
Why do we use a 12-week window to calculate the visit history of a device?
Ideally we would like to use a longer time-frame, but with a longer time-frame we run into issues of seasonality (for example, the brands that people visit during the winter are very different that during the summer). The 12-week threshold is a reasonable compromise between how far back in time to look without seasonality issues, and the need for a robust visitation history.
If you’re only looking at a 12-week window, is incrementality still good for verticals where purchases are done with low frequency (e.g. car dealerships, telco)?
Yes. The methodology only requires that people visit the store, regardless of whether they go often or not, because we don’t compare a device’s visits before and after the campaign. As long as there are visits being measured, the methodology is able to measure incrementality.
How should I interpret “loyalty” in the behavioral analysis section of Clara?
Loyalty (the horizontal axis) can be interpreted as the baseline likelihood that a device would have visited a brand store without the campaign. Values to the left along the axis indicate less loyalty, that is, devices that in general would not have visited the POI of interest even without a campaign; values to the right along the axis indicate devices with high likelihood of visiting the POIs of interest regardless of the campaign.
How should I interpret the “incremental visits” axis in the behavioral analysis section of Clara?
Incremental visits (the horizontal axis) can be interpreted as how sensitive the device was to a campaign exposure. If a device is more sensitive to a campaign (up along the vertical axis) it will show more incremental visits (that is, the message resonated with the person holding that device).
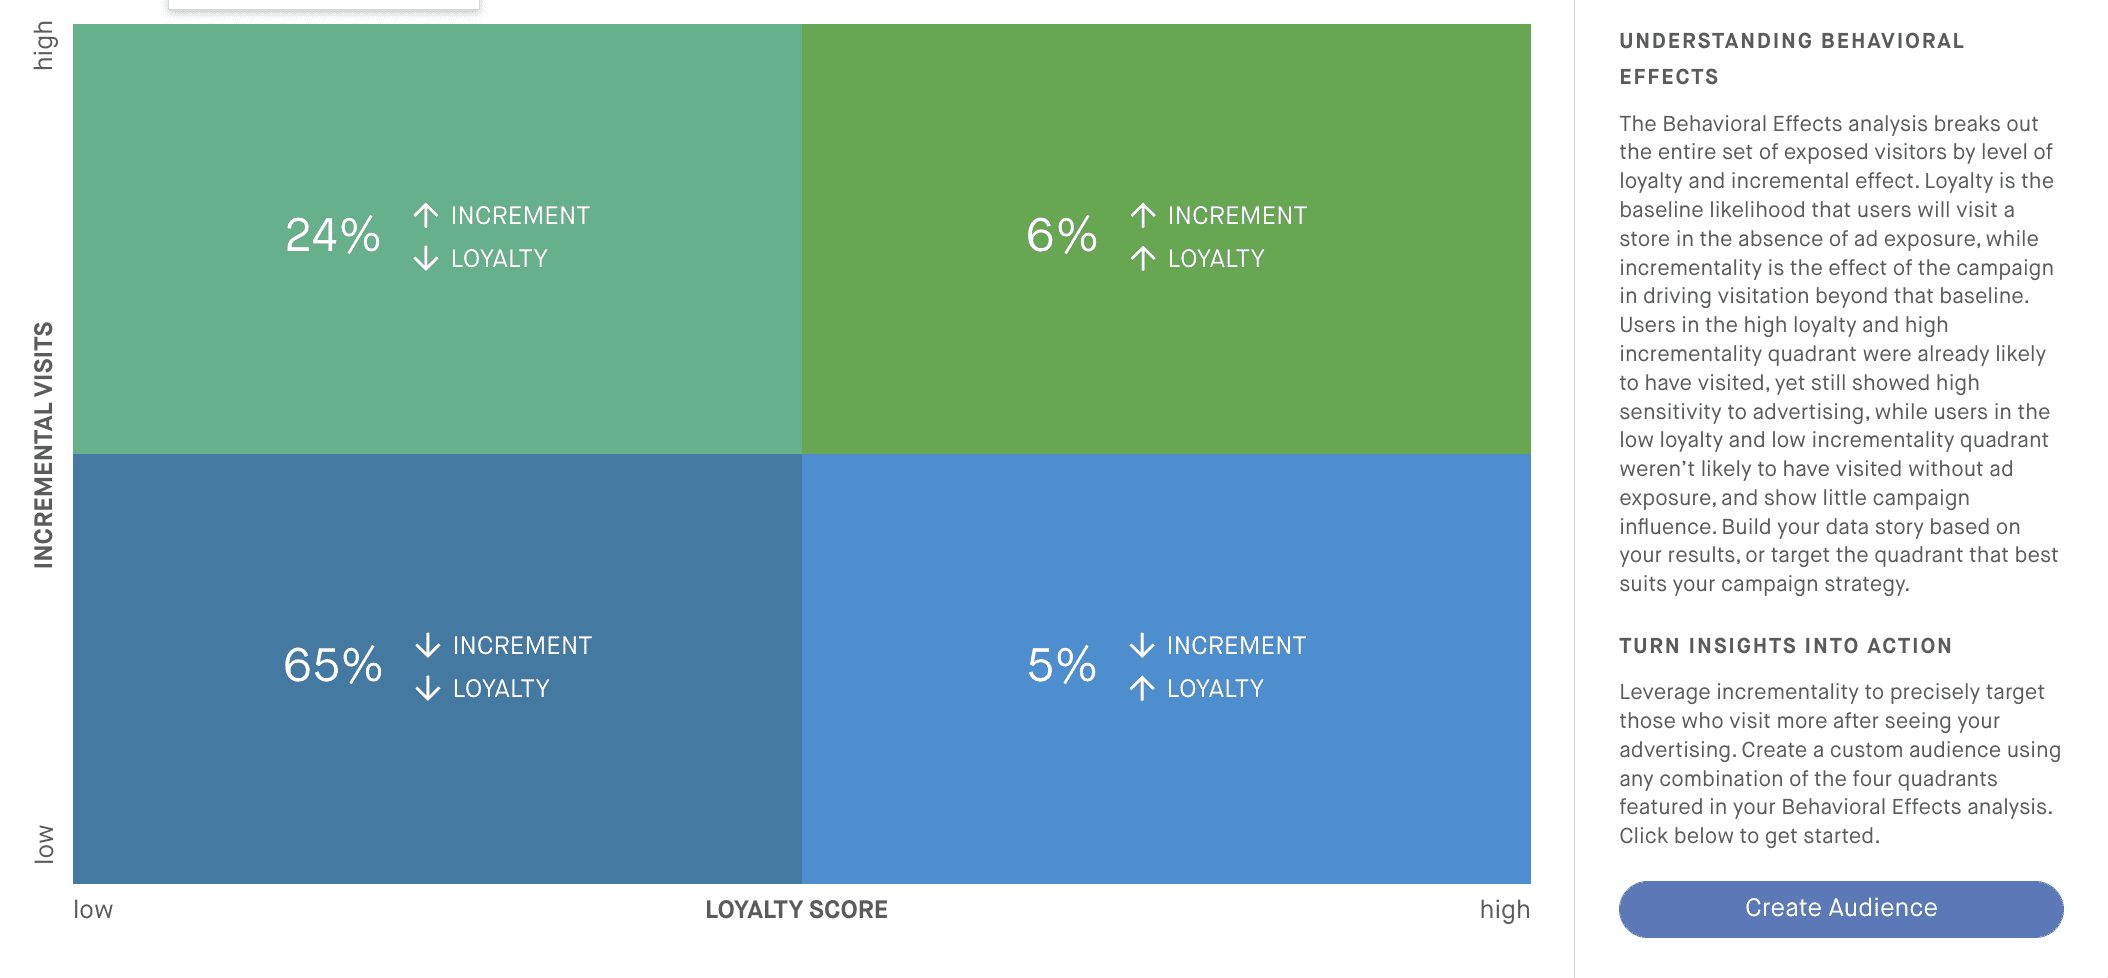
What are the quadrants in the behavioral analysis section of Clara?
The quadrants divide all the matched devices in a campaign into 4 personas, depending on how loyal (high/low), and how sensitive they were to the campaign (high/low). Please see the definitions for “loyalty” and “incremental visits” in this FAQ for more details about the meaning of these terms. The four quadrants are:
- Upper left: Low loyalty / high incremental visits. These devices in general would not visit the brand of interest, but they show high campaign effectiveness.
- Lower left: Low loyalty / low incremental visits. These devices in general would not visit the brand of interest, and show low campaign effectiveness. Basically lost dollars because they never visit, and didn’t care for the campaign messaging.
- Lower right: High loyalty / low incremental visits. These devices usually visit the brand of interest, but the campaign had very little effect on them. For these loyal devices the campaign message was either redundant or simply not relevant.
- Upper right: High loyalty / high incremental visits. These devices in general visit the stores of interest more often than not, and the campaign message resonated with them to the point of increasing their visits.
Which quadrants in the behavioral analysis section of Clara are better?
The top two quadrants are in general more desirable because they indicate high campaign effects. Whether it is desirable that these high effects appear on loyal devices or not depends entirely on the goal of the campaign. If a campaign wants to bring in customers that usually won’t visit, an upper left quadrant is more desirable, but if a campaign’s goal is to cater to already loyal customers (for example, for branding) then the upper right quadrant is more desirable.
What is the feasibility threshold for a campaign?
Before accepting a campaign, Cuebiq looks at the structure of the campaign to determine if there is enough data to make the attribution pipeline worth running. We look at things like the number of impressions in a campaign and the number of POIs measured, the number of DMAs. If we determine that there are enough of these, we accept the campaign.
What about the 250 visit threshold to show incrementality results in Clara?
Even if Cuebiq accepts a campaign (see “feasibility threshold” in this FAQ), we still need a minimum amount of total measured visits to guarantee that our results are reliable, that is, they won’t be subject to too much change. We determined that 250 total measured visits (in both control and exposed groups) is a good threshold between stability and how fast we can show results to our eager clients. Because the campaign has been running usually for a few days/weeks before it achieves this threshold, it is not uncommon to see incremental visits jump from 0 to a large number once we populate the results in Clara.
Can you provide more detail about how the methodology works?
We use a neural network with two branches, one for exposed devices and one for control devices. Each branch gets trained separately, and once training is done, the exposed devices are passed through the control branch, effectively reversing the exposure condition and generating predictions of visits for the exposed devices (with their specific visitation signatures) as if they were control. For more information please see our white paper here.
How do we interpret when the number of incremental visits remains flat in the Clara charts?
This means our methodology is not able to detect an increase in incremental visits with respect to the previous dates.
How do we interpret incrementality by SID?
Incrementality by SID is the simple sum of incremental visits of all devices that fall within the SID.
Please contact [email protected] for more information.


